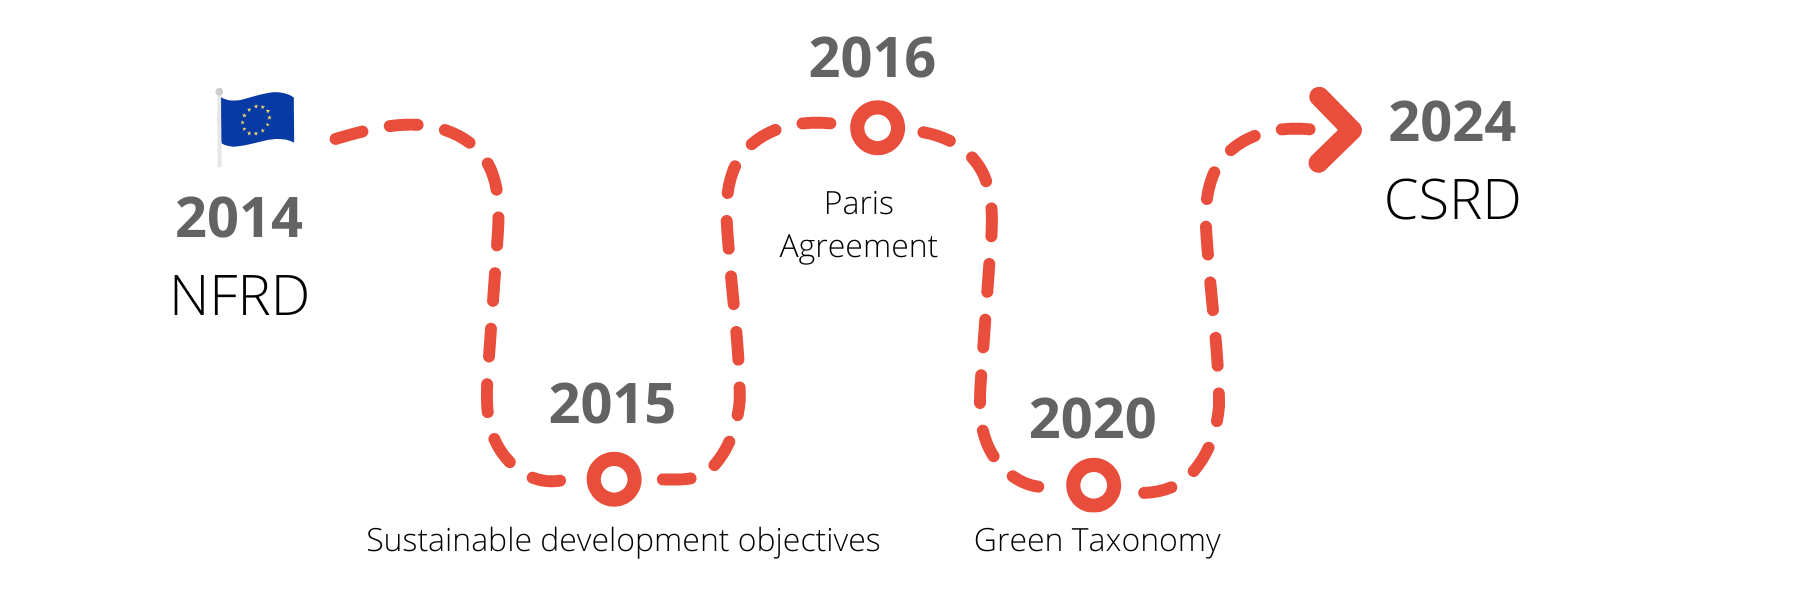
To manage this challenge, the European Commission dictates the applicable rules for all companies listed or not on European markets in its directive 2014/95/EU. In France, this represents approximately 3,800 companies (source: Mazars).
Financial communication, and more particularly ESG managers and investors, are therefore the first concerned. Their impact and their role are decisive in the transition and the resolution of ESG issues. The yield by activity is no longer a simple financial issue: it must report on the environmental, societal and governance areas.
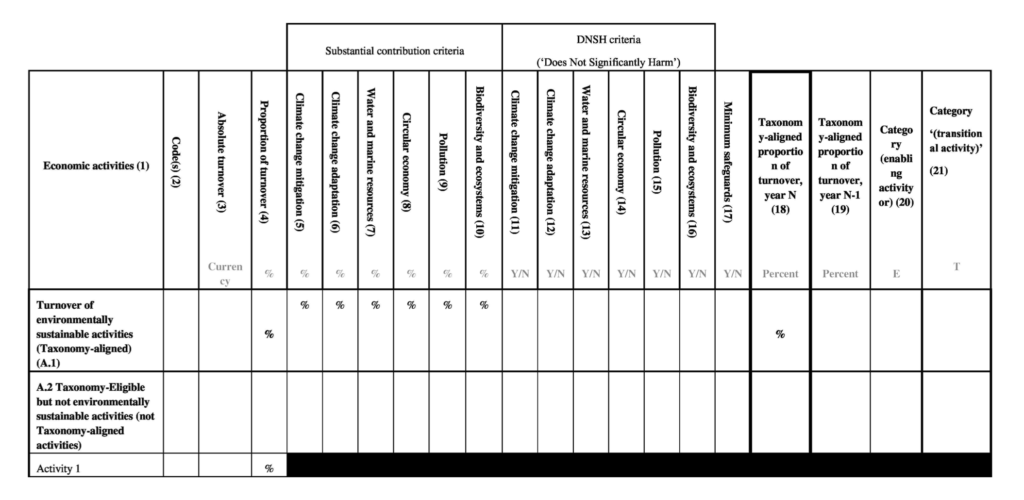
For companies, this takes concrete form through the introduction of performance indicators in extra-financial reports. In its legal text (article 8) published on July 6, 2021, Europe provides a table (in appendix 2) gathering key indicators enabling more standardized and comparable reading to ensure more transparency and visibility on the environmental and societal impact of companies This is the beginning of the green taxonomy.
Because we have noticed that its completeness has raised many questions, we have listed some keys to approach it with more peace of mind. Please note that each series of indicators adapts to the nature of the company’s services and products. As a first step, it is therefore recommended to identify the activities eligible for the green taxonomy, by listing the NACE codes corresponding to the eligible activities.
This year, the publication focuses on the eligibility of activities for environmental objectives linked to mitigation and adaptation of climate change. Next year, it will be necessary to respond to the alignment of these two criteria. Companies will also have to report on the eligibility of the 4 other objectives.
Then, three points must be taken into account in the development of this table: the share of turnover, investment expenses (CAPEX) and operating expenses (OPEX). For each of these parts, three main categories organize data for a better visibility. We thus find columns gathering substantial contribution criteria (quantified as a percentage), as well as criteria of absence of significant harm (DNSH, or Does Not Significantly Harm, supplemented by “yes” or “no”) and the share of the turnover aligned with the taxonomy (for years N and N-1, also quantified as a percentage).
Percentage of turnover, CAPEX and OPEX… These 3 indicators allow to communicate on the impact of the company with regard to its activities on the environment. It also enables to establish numerical references to ensure clear monitoring, with objectives set by the company’s overall ESG strategy. They become valuable performance indicators for investors, and help the companies to improve their transparency.
At Pomelo-Paradigm, our experts have supported several companies in creating this table and its layout directly on Pomdoc Pro and making it even more readable and accessible. Thus, this extra-financial data can be used now and will be easily tagged in 2024. Do not hesitate to contact us to discuss this subject and discover the future ESEF reporting.

